" />
class: center, middle, inverse, title-slide # Statistical modelling ## A grossly inadequate introduction ### <br><br>Danielle Navarro <span><i class="fab fa-twitter faa-float animated "></i> @djnavarro</span> ### <a href="https://djnavarro.github.io/chdss2018/" class="uri">https://djnavarro.github.io/chdss2018/</a><br><br>11 December 2018 --- class: split-40 bg-main1 .column.bg-main1[.content.vtop.center[ .pull.left[.pad1[.font2[ ```r tinyframes <- frames %>% group_by(id, age, condition) %>% summarise( response = mean(response) ) %>% ungroup() ``` ]]] ]] .column.bg-main3[.content.vtop.center[ .pull.left[.pad1[.font2[ # Simplified data set - Average all responses by an individual - Ignores effect of number of observations - Each person provides one "average response" - Impoverished, but easy to analyse! ]]] ]] <!-- *********** NEW SLIDE ************** --> --- class: split-40 bg-main1 .column.bg-main1[.content.vtop.center[ .pull.left[.pad1[.font2[ ```r tinyframes <- frames %>% group_by(id, age, condition) %>% summarise( response = mean(response) ) %>% ungroup() *tinyframes ``` ]]] ]] .column.bg-main3[.content.vtop.center[ .pull.left[.pad1[.font2[ ``` ## # A tibble: 225 x 4 ## id age condition response ## <int> <int> <chr> <dbl> ## 1 1 36 category 5.33 ## 2 2 46 category 7.05 ## 3 3 33 property 4.86 ## 4 4 71 property 3.86 ## 5 5 23 property 9 ## 6 6 31 category 7.90 ## 7 7 23 property 3.76 ## 8 8 31 property 4 ## 9 9 37 category 3.38 ## 10 10 46 category 5.86 ## # ... with 215 more rows ``` ]]] ]] <!-- *********** NEW SLIDE ************** --> --- class: split-40 bg-main1 .column.bg-main1[.content.vtop.center[ .pull.left[.pad1[.font2[ ```r tinyframes <- frames %>% group_by(id, age, condition) %>% summarise( response = mean(response) ) %>% ungroup() tinyframes %>% group_by(condition) %>% summarise( * mean_resp = mean(response), * sd_resp = sd(response), * n = n() ) ``` ]]] ]] -- .column.bg-main3[.content.vtop.center[ .pull.left[.pad1[.font2[ ``` ## # A tibble: 2 x 4 ## condition mean_resp sd_resp n ## <chr> <dbl> <dbl> <int> ## 1 category 5.40 1.56 114 ## 2 property 4.39 1.37 111 ``` ]]] ]] <!-- *********** NEW SLIDE ************** --> --- class: split-40 bg-main1 .column.bg-main1[.content.vtop.center[ .pull.left[.pad1[.font2[ ```r tinyframes %>% ggplot(aes( x = age, y = response, colour = condition)) + * geom_smooth(method = "lm") + geom_point() ``` - Is this difference meaningful? - What tools do we use to assess it? ]]] ]] .column.bg-main3[.content.vtop.center[ .pull.left[.pad1[.font2[ 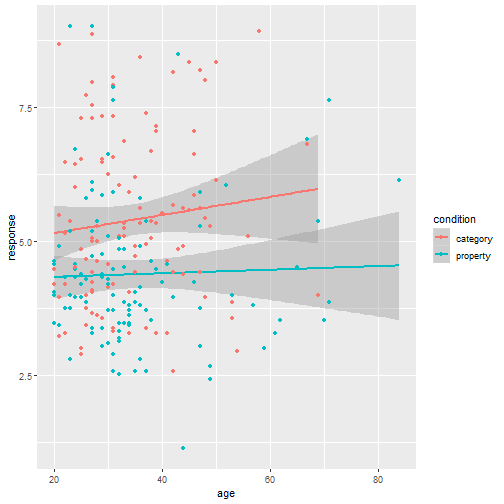<!-- --> ]]] ]] <!-- *********** NEW SLIDE ************** --> --- class: split-40 bg-main1 .column.bg-main1[.content.vtop.center[ .pull.left[.pad1[.font2[ ```r t.test( formula = response ~ condition, data = tinyframes, var.equal = TRUE ) ``` - The answer we were taught. - H0: same mean - H1: different mean - etc, etc ]]] ]] -- .column.bg-main3[.content.vtop.center[ .pull.left[.pad1[.font2[ ``` ## ## Two Sample t-test ## ## data: response by condition *## t = 5.1625, df = 223, p-value = 5.388e-07 ## alternative hypothesis: true difference in means is not equal to 0 ## 95 percent confidence interval: ## 0.6259535 1.3988834 ## sample estimates: ## mean in group category mean in group property ## 5.397661 4.385242 ``` - Yay the magic p<.05. Winning! ]]] ]] <!-- *********** NEW SLIDE ************** --> --- class: split-40 bg-main1 .column.bg-main1[.content.vtop.center[ .pull.left[.pad1[.font2[ ```r t.test( formula = response ~ condition, data = tinyframes, var.equal = TRUE ) ``` - The answer we were taught. - H0: same mean - H1: different mean - etc, etc ]]] ]] .column.bg-main3[.content.vtop.center[ .pull.left[.pad1[.font2[ ``` ## ## Two Sample t-test ## ## data: response by condition ## t = 5.1625, df = 223, p-value = 5.388e-07 ## alternative hypothesis: true difference in means is not equal to 0 ## 95 percent confidence interval: *## 0.6259535 1.3988834 ## sample estimates: ## mean in group category mean in group property ## 5.397661 4.385242 ``` - Effect size? - I'm not a fan of "standardised" effect size - 95% CI for the difference in raw scores... - ...it's about 1 point on the 9 point scale - divide by std. dev if you want Cohen's d ]]] ]] <!-- *********** NEW SLIDE ************** --> --- class: bg-main1 center middle hide-slide-number .reveal-text.bg-main2[.pad1[ .font4[Linear models] ]] <!-- *********** NEW SLIDE ************** --> --- class: split-40 bg-main1 .row.bg-main1[.content.vtop.center[ .pull.left[.pad1[.font2[ Linear models: `\(\mu_i = b_0 + b_1 X_1 + b_2 X_2 + ... + b_k X_k\)` <br> `\(Y_i \sim \mbox{Normal}(\mu_i, \sigma)\)` ]]] ]] .row.bg-main3[.content.vtop.center[ <!-- --> ]] <!-- *********** NEW SLIDE ************** --> --- class: split-40 bg-main1 .row.bg-main1[.content.vtop.center[ .pull.left[.pad1[.font2[ Linear models in R: ```r mod1 <- lm(formula = response ~ 1, data = tinyframes) mod2 <- lm(formula = response ~ condition, data = tinyframes) ``` ]]] ]] .row.bg-main3[.content.vtop.center[ <!-- --> ]] <!-- *********** NEW SLIDE ************** --> --- class: split-40 bg-main1 .row.bg-main1[.content.vtop.center[ .pull.left[.pad1[.font2[ Inspecting linear models in R: ```r mod1 <- lm(formula = response ~ 1, data = tinyframes) mod2 <- lm(formula = response ~ condition, data = tinyframes) mod2 ``` ]]] ]] -- .row.bg-main3[.content.vtop.center[ .pull.left[.pad1[.font2[ ``` ## ## Call: ## lm(formula = response ~ condition, data = tinyframes) ## ## Coefficients: ## (Intercept) conditionproperty *## 5.398 -1.012 ``` - Hey those numbers look familiar - Relationship to t.test? ]]] ]] <!-- *********** NEW SLIDE ************** --> --- class: split-40 bg-main1 .row.bg-main1[.content.vtop.center[ .pull.left[.pad1[.font2[ Comparing linear models with F-tests: ```r mod1 <- lm(formula = response ~ 1, data = tinyframes) mod2 <- lm(formula = response ~ condition, data = tinyframes) *anova(mod1, mod2) ``` ]]] ]] -- .row.bg-main3[.content.vtop.center[ .pull.left[.pad1[.font2[ ``` ## Analysis of Variance Table ## ## Model 1: response ~ 1 ## Model 2: response ~ condition ## Res.Df RSS Df Sum of Sq F Pr(>F) ## 1 224 539.98 *## 2 223 482.33 1 57.645 26.652 5.388e-07 *** ## --- ## Signif. codes: 0 '***' 0.001 '**' 0.01 '*' 0.05 '.' 0.1 ' ' 1 ``` ]]] ]] <!-- *********** NEW SLIDE ************** --> --- class: split-40 bg-main1 .row.bg-main1[.content.vtop.center[ .pull.left[.pad1[.font2[ Comparing several linear models with F-tests: ```r mod1 <- lm(formula = response ~ 1, data = tinyframes) mod2 <- lm(formula = response ~ condition, data = tinyframes) *mod3 <- lm(formula = response ~ condition + age, data = tinyframes) *anova(mod1, mod2, mod3) ``` ]]] ]] .row.bg-main3[.content.vtop.center[ .pull.left[.pad1[.font2[ ``` ## Analysis of Variance Table ## ## Model 1: response ~ 1 ## Model 2: response ~ condition ## Model 3: response ~ condition + age ## Res.Df RSS Df Sum of Sq F Pr(>F) ## 1 224 539.98 *## 2 223 482.33 1 57.645 26.6544 5.399e-07 *** *## 3 222 480.12 1 2.214 1.0238 0.3127 ## --- ## Signif. codes: 0 '***' 0.001 '**' 0.01 '*' 0.05 '.' 0.1 ' ' 1 ``` ]]] ]] --- class: bg-main1 center middle hide-slide-number # Why do I care about F-tests again???? <br><br> <img src="images/adaY.png" width="60%"> --- class: bg-main1 center middle .pull.left[.pad1[.font2[ # Eh. Let's skip the rant and jump to... TL;DR: What problem are you trying to solve? - Hypothesis testing vs estimation? - Bayesian inference vs frequentist? - Exploration vs confirmation? - Decision making vs learning? Different problems lead to different statistics<br> Orthodox null hypothesis tests are *specific* tools ]]] --- class: bg-main1 center middle .pull.left[.pad1[.font2[ # Eh. Let's skip the rant and jump to... TL;DR: What problem are you trying to solve? - .orange[Hypothesis testing] vs estimation? - Bayesian inference vs .orange[frequentist]? - Exploration vs .orange[confirmation]? - .orange[Decision making] vs learning? Different problems lead to different statistics<br> .orange[Orthodox null hypothesis tests] are *specific* tools ]]] --- class: bg-main1 center middle .pull.left[.pad1[.font2[ # Eh. Let's skip the rant and jump to... TL;DR: What problem are you trying to solve? - .blue[Hypothesis testing] vs estimation? - .blue[Bayesian inference] vs frequentist? - Exploration vs .blue[confirmation]? - Decision making vs learning.blue[???] Different problems lead to different statistics<br> .blue[Bayes factors] are *specific* tools ]]] --- class: bg-main1 center middle .pull.left[.pad1[.font2[ # Eh. Let's skip the rant and jump to... TL;DR: What problem are you trying to solve? - Hypothesis testing vs .yellow[estimation]? - .yellow[Bayesian inference] vs frequentist? - .yellow[Exploration] vs confirmation? - Decision making vs .yellow[learning] Most of .yellow[my modelling problems] are this!<br> :-) ]]] <!-- *********** NEW SLIDE ************** --> --- class: split-40 bg-main1 .row.bg-main1[.content.vtop.center[ .pull.left[.pad1[.font2[ Akaike Information Criterion? ```r mod1 <- lm(formula = response ~ 1, data = tinyframes) mod2 <- lm(formula = response ~ condition, data = tinyframes) mod3 <- lm(formula = response ~ condition + age, data = tinyframes) *AIC(mod1, mod2, mod3) ``` ]]] ]] -- .row.bg-main1[.content.vtop.center[ .pull.left[.pad1[.font2[ ``` ## df AIC ## mod1 2 839.4940 *## mod2 3 816.0928 ## mod3 4 817.0575 ``` ]]] ]] <!-- *********** NEW SLIDE ************** --> --- class: split-40 bg-main3 .row.bg-main3[.content.vtop.center[ .pull.left[.pad1[.font2[ Bayesian information criterion? ```r mod1 <- lm(formula = response ~ 1, data = tinyframes) mod2 <- lm(formula = response ~ condition, data = tinyframes) mod3 <- lm(formula = response ~ condition + age, data = tinyframes) *BIC(mod1, mod2, mod3) ``` ]]] ]] -- .row.bg-main3[.content.vtop.center[ .pull.left[.pad1[.font2[ ``` ## df BIC ## mod1 2 846.3262 *## mod2 3 826.3411 ## mod3 4 830.7219 ``` ]]] ]] <!-- *********** NEW SLIDE ************** --> --- class: split-50 bg-main1 .row.bg-main1[.content.vtop.center[ .pull.left[.pad1[.font2[ Bayes factors? ```r library(BayesFactor) tf <- as.data.frame(tinyframes) mod2b <- lmBF(formula = response ~ condition, data = tf) mod3b <- lmBF(formula = response ~ condition + age, data = tf) *mod2b / mod3b ``` ]]] ]] -- .row.bg-main1[.content.vtop.center[ .pull.left[.pad1[.font2[ ``` ## Bayes factor analysis ## -------------- *## [1] condition : 4.376014 ±1.64% ## ## Against denominator: ## response ~ condition + age ## --- ## Bayes factor type: BFlinearModel, JZS ``` ]]] ]] <!-- *********** NEW SLIDE ************** --> --- class: bg-main1 center middle hide-slide-number .reveal-text.bg-main2[.pad1[ .font4[Linear mixed models 1] ]] <!-- *********** NEW SLIDE ************** --> --- class: split-40 bg-main1 .column.bg-main1[.content.vtop.center[ .pull.left[.pad1[.font2[ ```r modestframes <- frames %>% group_by( id, age, condition, n_obs) %>% summarise( response = mean(response)) %>% ungroup() modestframes ``` - But what if I care about how people adjust their beliefs as more data arrive? <br><br> - If so, I don't want to collaps "n_obs", I want to analyse it ]]] ]] -- .column.bg-main3[.content.vtop.center[ .pull.left[.pad1[.font2[ ``` ## # A tibble: 675 x 5 ## id age condition n_obs response ## <int> <int> <chr> <int> <dbl> ## 1 1 36 category 2 5.86 ## 2 1 36 category 6 5.29 ## 3 1 36 category 12 4.86 *## 4 2 46 category 2 5.29 *## 5 2 46 category 6 7.57 *## 6 2 46 category 12 8.29 ## 7 3 33 property 2 5.43 ## 8 3 33 property 6 4.86 ## 9 3 33 property 12 4.29 ## 10 4 71 property 2 4.57 ## # ... with 665 more rows ``` ]]] ]] <!-- *********** NEW SLIDE ************** --> --- class: split-40 bg-main1 .column.bg-main1[.content.vtop.center[ .pull.left[.pad1[.font2[ ```r whichids <- modestframes %>% pull(id) %>% unique() %>% sample(size = 80) whichids ``` - Pick a random subset of 80 people... ]]] ]] .column.bg-main3[.content.vtop.center[ .pull.left[.pad1[.font2[ ``` ## [1] 216 206 61 45 143 175 71 186 24 178 50 122 184 219 220 26 2 ## [18] 88 200 36 147 211 35 55 132 8 109 102 25 119 96 6 23 212 ## [35] 12 214 76 13 169 39 57 53 91 46 162 199 145 148 183 136 82 ## [52] 67 4 117 141 49 81 110 170 11 29 207 127 174 99 94 51 120 ## [69] 209 108 89 42 77 73 100 153 60 204 48 7 ``` ]]] ]] <!-- *********** NEW SLIDE ************** --> --- class: split-40 bg-main1 .column.bg-main1[.content.vtop.center[ .pull.left[.pad1[.font2[ ```r whichids <- modestframes %>% pull(id) %>% unique() %>% sample(size = 80) modestframes %>% filter(id %in% whichids) %>% ggplot(aes( x = n_obs, y = response, colour = factor(id))) + geom_point( show.legend = FALSE, size = 8) + geom_line( show.legend = FALSE, alpha = .3) + facet_wrap(~ condition) ``` - ...and plot their responses ]]] ]] -- .column.bg-main3[.content.vtop.center[ .pull.left[.pad1[.font2[ 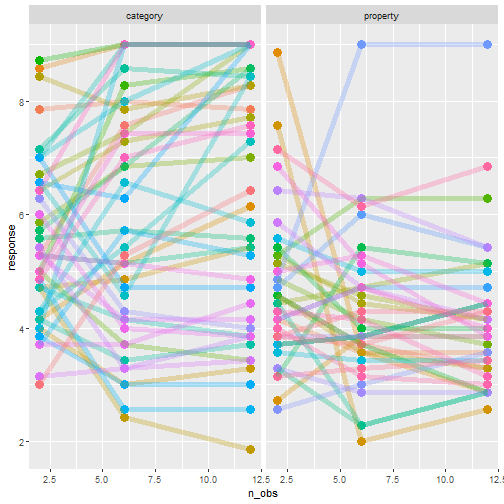<!-- --> ]]] ]] <!-- *********** NEW SLIDE ************** --> --- class: split-40 bg-main1 .column.bg-main1[.content.vtop.center[ .pull.left[.pad1[.font2[ Thoughts: - Systematic trend? - Not the same in each condition? - Not homogenous across people? <br><br><br><br> ]]] ]] .column.bg-main3[.content.vtop.center[ .pull.left[.pad1[.font2[ 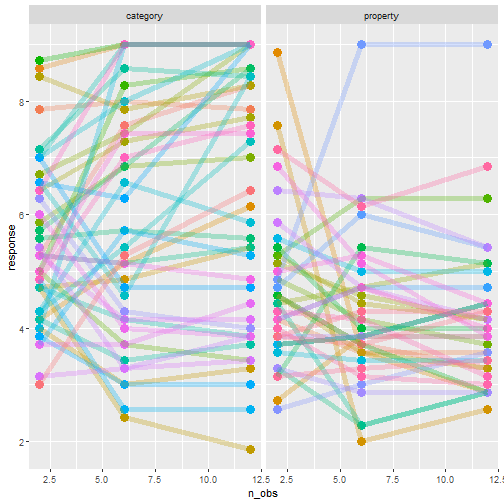<!-- --> ]]] ]] <!-- *********** NEW SLIDE ************** --> --- class: split-40 bg-main1 .column.bg-main1[.content.vtop.center[ .pull.left[.pad1[.font2[ Thoughts: - Systematic trend? - Not the same in each condition? - Not homogenous across people? Tools? - Repeated measures ANOVA? - MANOVA? - .orange[Linear mixed model] ]]] ]] .column.bg-main3[.content.vtop.center[ .pull.left[.pad1[.font2[ 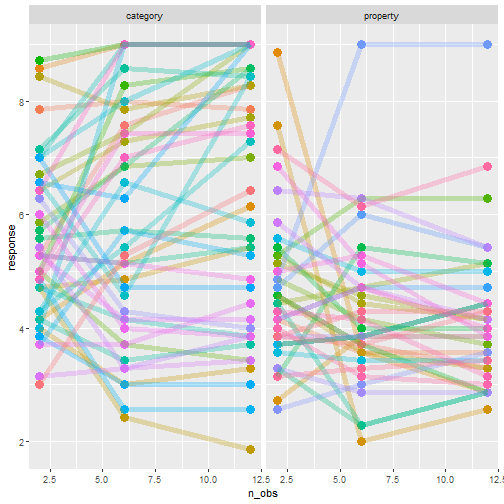<!-- --> ]]] ]] <!-- *********** NEW SLIDE ************** --> --- class: split-40 bg-main1 .row.bg-main1[.content.vtop.center[ .pull.left[.pad1[.font2[ Repeated measures ANOVA as a mixed model: ```r modest1 <- lmer(formula = response ~ 1 + (1|id), data = modestframes) modest2 <- lmer(formula = response ~ condition + n_obs + (1|id), data = modestframes) anova(modest1, modest2) ``` ]]] ]] -- .row.bg-main1[.content.vtop.center[ .pull.left[.pad1[.font2[ ``` ## Data: modestframes ## Models: ## modest1: response ~ 1 + (1 | id) ## modest2: response ~ condition + n_obs + (1 | id) ## Df AIC BIC logLik deviance Chisq Chi Df Pr(>Chisq) ## modest1 3 2354.9 2368.5 -1174.5 2348.9 ## modest2 5 2333.5 2356.1 -1161.8 2323.5 25.403 2 3.046e-06 *** ## --- ## Signif. codes: 0 '***' 0.001 '**' 0.01 '*' 0.05 '.' 0.1 ' ' 1 ``` ]]] ]] <!-- *********** NEW SLIDE ************** --> --- class: split-40 bg-main1 .column.bg-main1[.content.vtop.center[ .pull.left[.pad1[.font2[ But RM-ANOVA is absurd!!! Traditional RM-ANOVA allows: - random effect for intercept - fixed effects It doesn't do: - random slopes of conditions - so you have to believe all these lines are "really" the same slope... ]]] ]] .column.bg-main3[.content.vtop.center[ .pull.left[.pad1[.font2[ 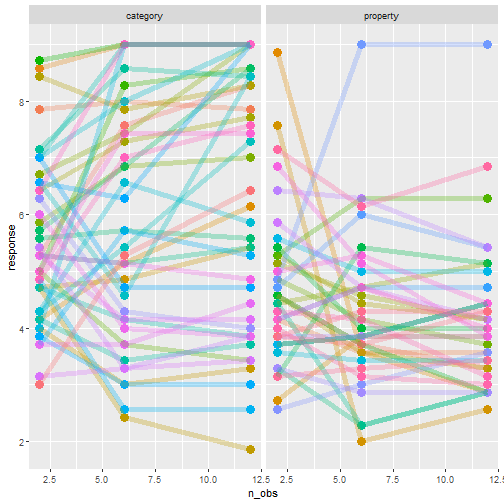<!-- --> ]]] ]] <!-- *********** NEW SLIDE ************** --> --- class: split-40 bg-main1 .row.bg-main1[.content.vtop.center[ .pull.left[.pad1[.font2[ ```r modest1 <- lmer(formula = response ~ 1 + (1|id), data = modestframes) modest2 <- lmer(formula = response ~ condition + n_obs + (1|id), data = modestframes) *modest3 <- lmer(formula = response ~ condition + n_obs + (1 + n_obs|id), data = modestframes) anova(modest1, modest2, modest3) ``` ]]] ]] -- .row.bg-main1[.content.vtop.center[ .pull.left[.pad1[.font2[ ``` ## Data: modestframes ## Models: ## modest1: response ~ 1 + (1 | id) ## modest2: response ~ condition + n_obs + (1 | id) *## modest3: response ~ condition + n_obs + (1 + n_obs | id) ## Df AIC BIC logLik deviance Chisq Chi Df Pr(>Chisq) ## modest1 3 2354.9 2368.5 -1174.5 2348.9 ## modest2 5 2333.5 2356.1 -1161.8 2323.5 25.403 2 3.046e-06 *** *## modest3 7 2270.4 2302.0 -1128.2 2256.4 67.164 2 2.603e-15 *** ## --- ## Signif. codes: 0 '***' 0.001 '**' 0.01 '*' 0.05 '.' 0.1 ' ' 1 ``` ]]] ]] <!-- *********** NEW SLIDE ************** --> --- class: split-30 bg-main1 .column.bg-main1[.content.vtop.center[ .pull.left[.pad1[.font2[ ```r summary(modest3) ``` ]]] ]] .column.bg-main3[.content.vtop.center[ .pull.left[.pad1[.font2[ ``` ... ## Linear mixed model fit by REML ['lmerMod'] ## Formula: response ~ condition + n_obs + (1 + n_obs | id) ## Data: modestframes ## *## REML criterion at convergence: 2267.9 ## ## Scaled residuals: ## Min 1Q Median 3Q Max ## -2.8960 -0.3681 -0.0306 0.3557 3.3860 ## ... ``` - Terminology: - ML: Maximum likelihood - REML: Restricted maximum likelihood - What's the difference? - ML: Fit everything at once - REML: Fit fixed first, then fit random ]]] ]] <!-- *********** NEW SLIDE ************** --> --- class: split-30 bg-main1 .column.bg-main1[.content.vtop.center[ .pull.left[.pad1[.font2[ ```r summary(modest3) ``` ]]] ]] .column.bg-main3[.content.vtop.center[ .pull.left[.pad1[.font2[ ``` ... ## Linear mixed model fit by REML ['lmerMod'] ## Formula: response ~ condition + n_obs + (1 + n_obs | id) ## Data: modestframes ## ## REML criterion at convergence: 2267.9 ## ## Scaled residuals: *## Min 1Q Median 3Q Max *## -2.8960 -0.3681 -0.0306 0.3557 3.3860 ## ... ``` - This is pointless - Yes, it's **very** important to look at residuals - But this summary is unreadable - Just plot them (coming soon!) ]]] ]] <!-- *********** NEW SLIDE ************** --> --- class: split-30 bg-main1 .column.bg-main1[.content.vtop.center[ .pull.left[.pad1[.font2[ ```r summary(modest3) ``` ]]] ]] .column.bg-main3[.content.vtop.center[ .pull.left[.pad1[.font2[ ``` ... ## Random effects: ## Groups Name Variance Std.Dev. Corr ## id (Intercept) 1.72618 1.3138 ## n_obs 0.01684 0.1298 -0.21 ## Residual 0.55277 0.7435 ## Number of obs: 675, groups: id, 225 ## ## Fixed effects: ## Estimate Std. Error t value *## (Intercept) 5.2256978 0.1385646 37.713 *## conditionproperty -0.6693767 0.1874783 -3.570 *## n_obs 0.0004094 0.0111058 0.037 ## ... ``` - Estimated average effect of condition is about .7? - Estimated average effect of n_obs exists, but is small? - Don't forget: this is raw scale (condition: 0-1, n_obs: 2-12) ]]] ]] <!-- *********** NEW SLIDE ************** --> --- class: split-30 bg-main1 .column.bg-main1[.content.vtop.center[ .pull.left[.pad1[.font2[ ```r summary(modest3) ``` ]]] ]] .column.bg-main3[.content.vtop.center[ .pull.left[.pad1[.font2[ ``` ... ## Random effects: ## Groups Name Variance Std.Dev. Corr *## id (Intercept) 1.72618 1.3138 *## n_obs 0.01684 0.1298 -0.21 ## Residual 0.55277 0.7435 ## Number of obs: 675, groups: id, 225 ## ## Fixed effects: ## Estimate Std. Error t value ## (Intercept) 5.2256978 0.1385646 37.713 ## conditionproperty -0.6693767 0.1874783 -3.570 ## n_obs 0.0004094 0.0111058 0.037 ## ... ``` - Random effects (presumed normal, mean zero) - Random effects look quite variable, so take care - Looks like slope & intercept are correlated (grossly typical) ]]] ]] <!-- *********** NEW SLIDE ************** --> --- class: split-30 bg-main1 .row.bg-main1[.content.vtop.center[ .pull.left[.pad1[.font2[ ```r modestframes$modelfit <- predict(modest3) modestframes$resid <- residuals(modest3) modestframes ``` ]]] ]] -- .row.bg-main3[.content.vtop.center[ .pull.left[.pad1[.font2[ ``` ## # A tibble: 675 x 7 ## id age condition n_obs response modelfit resid ## <int> <int> <chr> <int> <dbl> <dbl> <dbl> ## 1 1 36 category 2 5.86 5.55 0.310 ## 2 1 36 category 6 5.29 5.33 -0.0479 ## 3 1 36 category 12 4.86 5.01 -0.156 ## 4 2 46 category 2 5.29 6.07 -0.783 ## 5 2 46 category 6 7.57 6.83 0.746 ## 6 2 46 category 12 8.29 7.96 0.324 ## 7 3 33 property 2 5.43 5.07 0.354 ## 8 3 33 property 6 4.86 4.84 0.0179 ## 9 3 33 property 12 4.29 4.49 -0.200 ## 10 4 71 property 2 4.57 4.27 0.305 ## # ... with 665 more rows ``` ]]] ]] <!-- *********** NEW SLIDE ************** --> --- class: split-30 bg-main1 .column.bg-main1[.content.vtop.center[ .pull.left[.pad1[.font2[ ```r modestframes %>% ggplot(aes( * x = modelfit, * y = response)) + geom_point() ``` ]]] ]] .column.bg-main3[.content.vtop.center[ .pull.left[.pad1[.font2[ 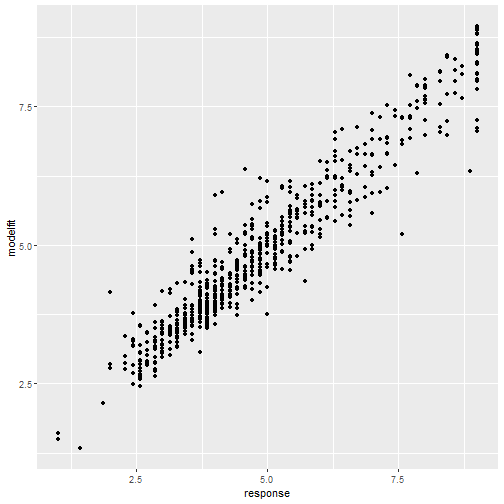<!-- --> ]]] ]] <!-- *********** NEW SLIDE ************** --> --- class: split-30 bg-main1 .column.bg-main1[.content.vtop.center[ .pull.left[.pad1[.font2[ ```r modestframes %>% ggplot(aes( x = response, y = modelfit)) + geom_point() + * facet_grid( * condition ~ n_obs) + geom_abline( intercept = 0, slope = 1) ``` ]]] ]] .column.bg-main3[.content.vtop.center[ .pull.left[.pad1[.font2[ 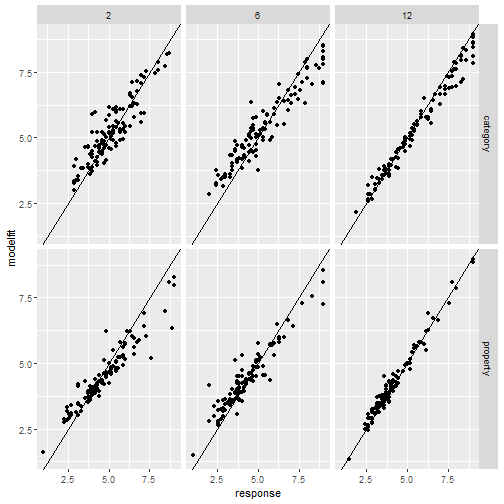<!-- --> ]]] ]] <!-- *********** NEW SLIDE ************** --> --- class: split-30 bg-main1 .column.bg-main1[.content.vtop.center[ .pull.left[.pad1[.font2[ ```r modestframes %>% ggplot(aes( * x = response, * y = resid)) + geom_point() + facet_grid( condition ~ n_obs) + geom_hline( yintercept = 0) ``` A systematic misfit? ]]] ]] .column.bg-main3[.content.vtop.center[ .pull.left[.pad1[.font2[ 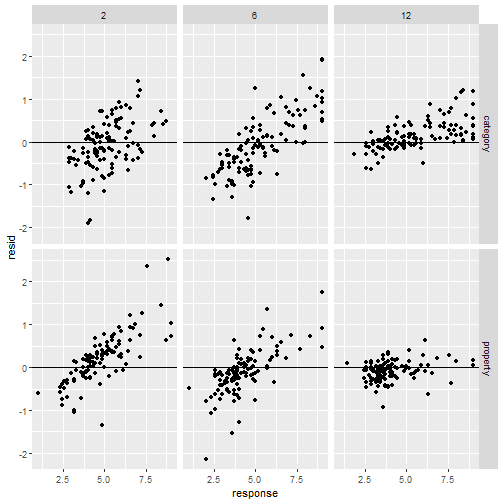<!-- --> ]]] ]] <!-- *********** NEW SLIDE ************** --> --- class: split-40 bg-main1 .column.bg-main1[.content.vtop.center[ .pull.left[.pad1[.font2[ ```r modestframes %>% filter(id %in% whichids) %>% ggplot(aes( * x = n_obs, y = modelfit, colour = factor(id))) + geom_point( show.legend = FALSE, size = 4) + geom_line( show.legend = FALSE, lwd = 2, alpha = .3) + facet_wrap(~ condition) ``` But it's a little closer! ]]] ]] .column.bg-main3[.content.vtop.center[ .pull.left[.pad1[.font2[ 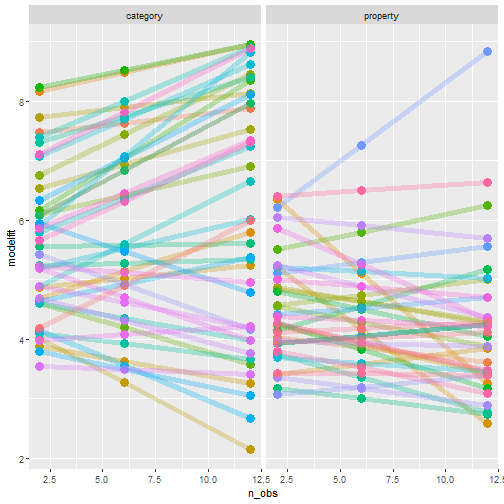<!-- --> ]]] ]] <!-- *********** NEW SLIDE ************** --> --- class: bg-main1 center middle hide-slide-number .reveal-text.bg-main2[.pad1[ .font4[Linear mixed models 2] ]] <!-- *********** NEW SLIDE ************** --> --- class: split-40 bg-main1 .column.bg-main1[.content.vtop.center[ .pull.left[.pad1[.font2[ ```r whichids <- modestframes %>% pull(id) %>% unique() %>% sample(size = 20) frames %>% filter(id %in% whichids) %>% ggplot(aes( x = test_item, y = response, shape = condition, colour = factor(n_obs))) + geom_point(size = 2) + geom_line() + facet_wrap(~ id) ``` Okay, let's tackle the full data set ]]] ]] .column.bg-main3[.content.vtop.center[ .pull.left[.pad1[.font2[ 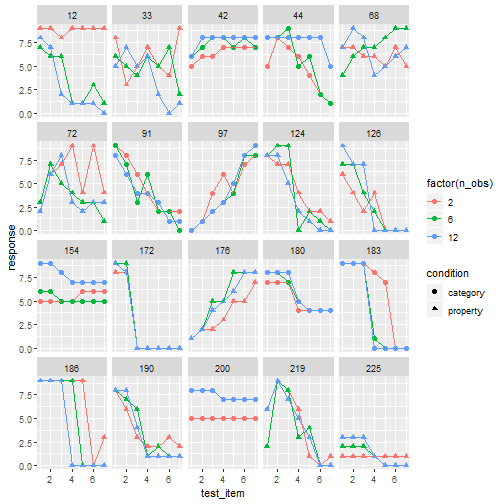<!-- --> ]]] ]] <!-- *********** NEW SLIDE ************** --> --- class: split-40 bg-main1 .row.bg-main1[.content.vtop.center[ .pull.left[.pad1[.font2[ Let's start with two sensible models: ```r linframes1 <- lmer(formula = response ~ condition + n_obs + (1 + n_obs|id), data = frames) linframes2 <- lmer(formula = response ~ condition + test_item + (1 + test_item + n_obs|id), data = frames) anova(linframes1, linframes2) ``` ]]] ]] -- .row[.content.vtop.center[ .pull.left[.pad1[.font2[ ``` ## Data: frames ## Models: ## linframes1: response ~ condition + n_obs + (1 + n_obs | id) ## linframes2: response ~ condition + test_item + (1 + test_item + n_obs | id) ## Df AIC BIC logLik deviance Chisq Chi Df Pr(>Chisq) ## linframes1 7 23128 23173 -11556.8 23114 *## linframes2 10 19732 19796 -9855.8 19712 3402 3 < 2.2e-16 *** ## --- ## Signif. codes: 0 '***' 0.001 '**' 0.01 '*' 0.05 '.' 0.1 ' ' 1 ``` ]]] ]] <!-- *********** NEW SLIDE ************** --> --- class: split-40 bg-main1 .column.bg-main1[.content.vtop.center[ .pull.left[.pad1[.font2[ ```r # store model predictions linframes <- frames linframes$modelfit <- predict(linframes2) linframes$resid <- residuals(linframes2) # plot linframes %>% filter(id %in% whichids) %>% ggplot(aes( * x = test_item, y = response, shape = condition, colour = factor(n_obs))) + geom_point(size = 2) + geom_line( * aes(y = modelfit)) + facet_wrap(~ id) ``` ]]] ]] .column.bg-main3[.content.vtop.center[ .pull.left[.pad1[.font2[ 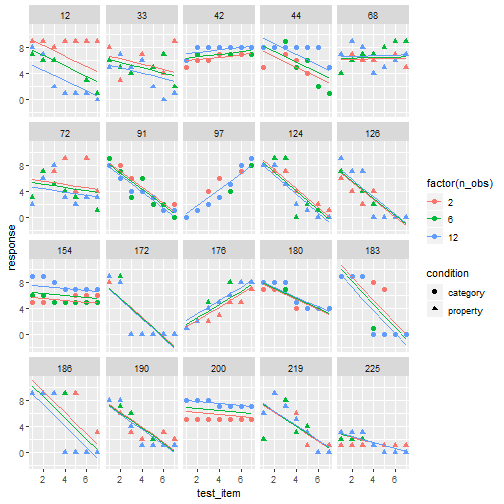<!-- --> ]]] ]] <!-- *********** NEW SLIDE ************** --> --- class: split-30 bg-main1 .column.bg-main1[.content.vtop.center[ .pull.left[.pad1[.font2[ ```r linframes %>% ggplot(aes( * x = response, * y = resid)) + geom_point() + facet_grid( condition ~ n_obs) + geom_hline( yintercept = 0) ``` A systematic misfit? STILL? ]]] ]] -- .column.bg-main1[.content.vtop.center[ .pull.left[.pad1[.font2[ <!-- --> ]]] ]] <!-- *********** NEW SLIDE ************** --> --- class: split-30 bg-main1 .column.bg-main1[.content.vtop.center[ .pull.left[.pad1[.font2[ ```r linframes %>% ggplot(aes( x = response, y = resid)) + geom_point() + facet_grid( * n_obs ~ test_item) + geom_hline( yintercept = 0) ``` A systematic misfit? STILL? ]]] ]] -- .column.bg-main1[.content.vtop.center[ .pull.left[.pad1[.font2[ <!-- --> ]]] ]] <!-- *********** NEW SLIDE ************** --> --- class: bg-main1 center middle hide-slide-number .reveal-text.bg-main2[.pad1[ .font4[Generalised linear mixed models] ]] <!-- *********** NEW SLIDE ************** --> --- class: bg-main1 center middle # Yeah, maybe not today... <br> <img src="images/glmer.png", width="80%"> <br> (GLMMs allow you to fit more complicated models that can capture the nonlinearities that are causing the systematic misfits. It is briefly discussed in [the tutorial](statistics.html)) <!-- *********** NEW SLIDE ************** --> --- class: bg-main1 center middle .pad1[.font2[ [Between the devil and the deep blue sea](https://link.springer.com/article/10.1007/s42113-018-0019-z) .pull.left[ - .orange[Mice & tigers]. All models are *systematically* wrong. But when are they useful? - .orange[Hindsight bias]. Model fitting is not prediction, exploration is not confirmation - .orange[Psychometric fallacy]. Statistical modelling is not theory development... ] ]] <!-- DONE --> --- class: bg-main3 middle center ## thank you! <img src="images/bridge-of-eels.gif" width="70%">