" />
class: center, middle, inverse, title-slide # Prettiness with ggplot2 ### <br><br>Danielle Navarro <span><i class="fab fa-twitter faa-float animated "></i> @djnavarro</span> ### <a href="https://djnavarro.github.io/chdss2018/" class="uri">https://djnavarro.github.io/chdss2018/</a><br><br>11 December 2018 --- class: split-two bg-main1 .column.bg-main1[.content.vmiddle.center[ # Data visualisation <br> .pull.left[.pad1[ ### .orange[**What?**] Drawing pictures ### .orange[**Why?**] Understand your data ### .orange[**How?**] Using tidyverse (ggplot2) ]] ]] .column.bg-main3[.content.vmiddle.center[ <img src="images/horst_ggplot.png", width="70%"> [@allison_horst](https://twitter.com/allison_horst) ]] <!-- *********** NEW SLIDE ************** --> --- class: split-40 bg-main1 .column.bg-main1[.content.vtop.center[ .pull.left[.pad1[.font2[ # Start simple: ```r frames_small <- frames %>% group_by( id, gender, age, condition ) %>% summarise( response = mean(response) ) %>% ungroup() frames_small ``` ]]] ]] .column.bg-main3[.content.vtop.center[ .pull.left[.pad1[.font2[ # The data: ``` ## # A tibble: 225 x 5 ## id gender age condition response ## <int> <chr> <int> <chr> <dbl> ## 1 1 male 36 category 5.33 ## 2 2 male 46 category 7.05 ## 3 3 female 33 property 4.86 ## 4 4 female 71 property 3.86 ## 5 5 female 23 property 9 ## 6 6 female 31 category 7.90 ## 7 7 male 23 property 3.76 ## 8 8 female 31 property 4 ## 9 9 female 37 category 3.38 ## 10 10 female 46 category 5.86 ## # ... with 215 more rows ``` ]]] ]] <!-- *********** NEW SLIDE ************** --> --- class: bg-main1 center middle hide-slide-number .reveal-text.bg-main2[.pad1[ .font4[Example 1: Histograms] ]] <!-- *********** NEW SLIDE ************** --> --- class: split-40 bg-main1 .column.bg-main1[.content.vtop.center[ .pull.left[.pad1[.font2[ ```r frames_small %>% ggplot() ``` - Start with blank canvas ]]] ]] -- .column.bg-main3[.content.vtop.center[ .pad1[.font2[ <!-- --> ]] ]] <!-- *********** NEW SLIDE ************** --> --- class: split-40 bg-main1 .column.bg-main1[.content.vtop.center[ .pull.left[.pad1[.font2[ ```r frames_small %>% ggplot( * aes(x = age) ) ``` - aes() adds an *aesthetic*: things that can represent data<br><br> - x-axis location - y-axis location - colour of marker - fill of a marker - shape of a marker ]]] ]] -- .column.bg-main3[.content.vtop.center[ .pad1[.font2[ <!-- --> ]] ]] <!-- *********** NEW SLIDE ************** --> --- class: split-40 bg-main1 .column.bg-main1[.content.vtop.center[ .pull.left[.pad1[.font2[ ```r frames_small %>% ggplot(aes(x = age)) + * geom_histogram() ``` - add "geometries": functions that represent data on the plot<br><br> - **NOTE**: use `+` not `%>%` - (historical artifact) ]]] ]] -- .column.bg-main3[.content.vtop.center[ .pad1[.font2[ <!-- --> ]] ]] <!-- *********** NEW SLIDE ************** --> --- class: bg-main1 center middle hide-slide-number .reveal-text.bg-main2[.pad1[ .font4[Example 2: Scatter plots] ]] <!-- *********** NEW SLIDE ************** --> --- class: split-40 bg-main1 .column.bg-main1[.content.vtop.center[ .pull.left[.pad1[.font2[ ```r frames_small %>% ggplot() ``` ]]] ]] -- .column.bg-main3[.content.vtop.center[ .pad1[.font2[ <!-- --> ]] ]] <!-- *********** NEW SLIDE ************** --> --- class: split-40 bg-main1 .column.bg-main1[.content.vtop.center[ .pull.left[.pad1[.font2[ ```r frames_small %>% ggplot( mapping = aes( * x = age, * y = response ) ) ``` - Different plots use different aesthetics! - Geoms "understand" some aesthetics and not others ]]] ]] .column.bg-main3[.content.vtop.center[ .pad1[.font2[ <!-- --> ]] ]] <!-- *********** NEW SLIDE ************** --> --- class: split-40 bg-main1 .column.bg-main1[.content.vtop.center[ .pull.left[.pad1[.font2[ ```r frames_small %>% ggplot( mapping = aes( x = age, y = response )) + * geom_point() ``` - the "point" geom draws...points ]]] ]] .column.bg-main3[.content.vtop.center[ .pad1[.font2[ 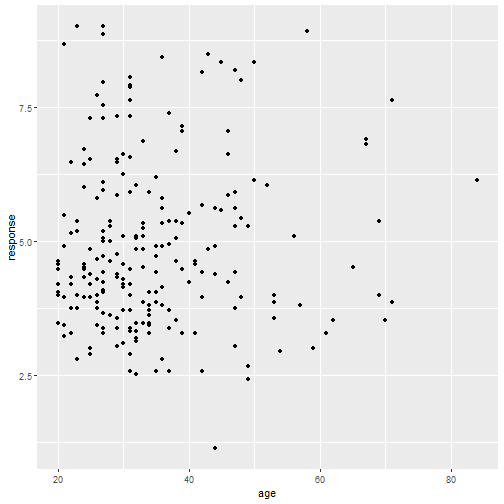<!-- --> ]] ]] <!-- *********** NEW SLIDE ************** --> --- class: split-40 bg-main1 .column.bg-main1[.content.vtop.center[ .pull.left[.pad1[.font2[ ```r frames_small %>% ggplot( mapping = aes( x = age, y = response, * colour = condition )) + geom_point() ``` - the "point" geom draws...points - you can use colour nicely ]]] ]] .column.bg-main3[.content.vtop.center[ .pad1[.font2[ 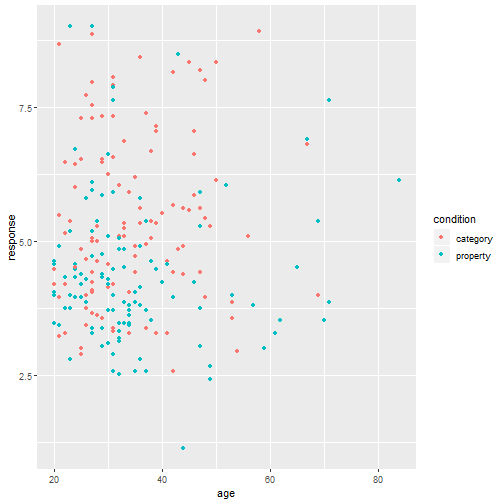<!-- --> ]] ]] <!-- *********** NEW SLIDE ************** --> --- class: split-40 bg-main1 .column.bg-main1[.content.vtop.center[ .pull.left[.pad1[.font2[ ```r frames_small %>% ggplot( mapping = aes( x = age, y = response, colour = condition )) + geom_point() + * geom_rug() ``` - the "point" geom draws...points - you can use colour nicely - you can **layer** geoms ]]] ]] .column.bg-main3[.content.vtop.center[ .pad1[.font2[ 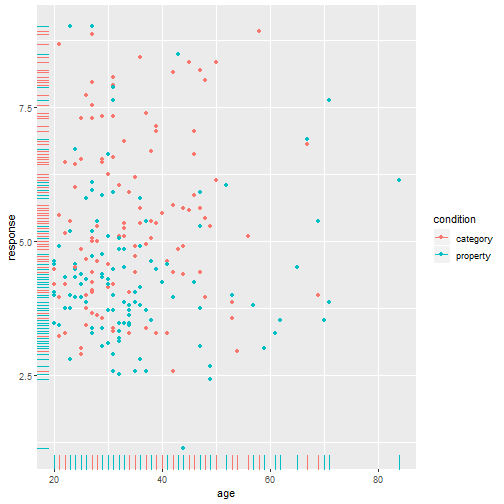<!-- --> ]] ]] <!-- *********** NEW SLIDE ************** --> --- class: split-40 bg-main1 .column.bg-main1[.content.vtop.center[ .pull.left[.pad1[.font2[ ```r frames_small %>% ggplot( mapping = aes( x = age, y = response, colour = condition )) + geom_point() + geom_rug() + * facet_wrap(~condition) ``` - the "point" geom draws...points - you can use colour nicely - you can **layer** geoms - you can add **facets** ]]] ]] .column.bg-main3[.content.vtop.center[ .pad1[.font2[ 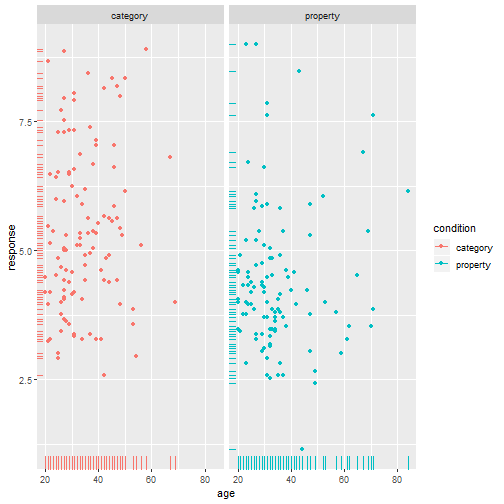<!-- --> ]] ]] <!-- *********** NEW SLIDE ************** --> --- class: split-40 bg-main1 .column.bg-main1[.content.vtop.center[ .pull.left[.pad1[.font2[ ```r frames_small %>% ggplot( mapping = aes( x = age, y = response, colour = condition )) + geom_point() + geom_rug() + facet_wrap(~condition) + * theme_bw() ``` - the "point" geom draws...points - you can use colour nicely - you can **layer** geoms - you can add **facets** - and **themes** ]]] ]] .column.bg-main3[.content.vtop.center[ .pad1[.font2[ 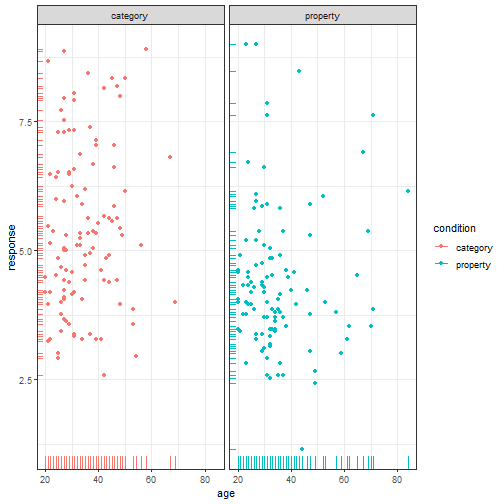<!-- --> ]] ]] <!-- *********** NEW SLIDE ************** --> --- class: bg-main1 center middle hide-slide-number .reveal-text.bg-main2[.pad1[ .font4[Examples 3-5: Bars, boxes and violins] ]] <!-- *********** NEW SLIDE ************** --> --- class: split-40 bg-main1 .column.bg-main1[.content.vtop.center[ .pull.left[.pad1[.font2[ ```r frames_small %>% ggplot(aes(x = gender)) + facet_wrap(~condition) + * geom_bar() ``` - It does bar plots, but - ... this is so boring ]]] ]] -- .column.bg-main3[.content.vtop.center[ .pad1[.font2[ <!-- --> ]] ]] <!-- *********** NEW SLIDE ************** --> --- class: split-40 bg-main1 .column.bg-main1[.content.vtop.center[ .pull.left[.pad1[.font2[ ```r frames_small %>% ggplot(aes( x = condition, y = response )) + * geom_boxplot() ``` - Boxplots use Tukey's "five number summary" to represent distribution of responses - Median, interquartile range, range ]]] ]] -- .column.bg-main3[.content.vtop.center[ .pad1[.font2[ <!-- --> ]] ]] <!-- *********** NEW SLIDE ************** --> --- class: split-40 bg-main1 .column.bg-main1[.content.vtop.center[ .pull.left[.pad1[.font2[ ```r frames_small %>% ggplot(aes( x = condition, y = response )) + * geom_violin() ``` - Violin plots are a modern take - Width of the violin is a "kernel density estimate" - (it's a smoothing of your data) ]]] ]] .column.bg-main3[.content.vtop.center[ .pad1[.font2[ 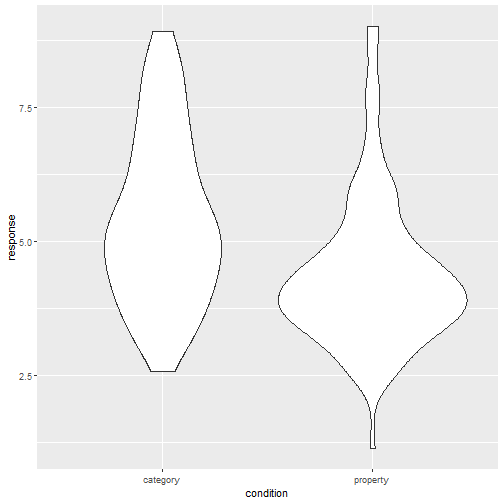<!-- --> ]] ]] <!-- *********** NEW SLIDE ************** --> --- class: split-40 bg-main1 .column.bg-main1[.content.vtop.center[ .pull.left[.pad1[.font2[ ```r frames_small %>% ggplot(aes( x = condition, y = response )) + geom_violin() + * geom_jitter() ``` - "Jittered" points highlights this ]]] ]] .column.bg-main3[.content.vtop.center[ .pad1[.font2[ 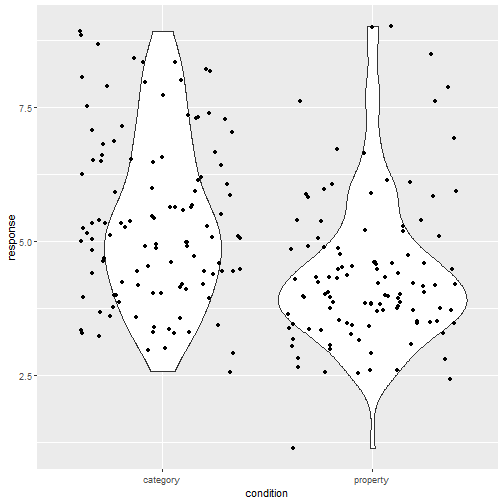<!-- --> ]] ]] <!-- *********** NEW SLIDE ************** --> --- class: bg-main1 center middle hide-slide-number .reveal-text.bg-main2[.pad1[ .font4[Examples 6: Getting fancy?] ]] <!-- *********** NEW SLIDE ************** --> --- class: split-40 bg-main1 .column.bg-main1[.content.vtop.center[ .pull.left[.pad1[.font2[ ```r frames %>% ggplot(mapping = aes( x = test_item, y = response )) + * geom_count() ``` - "count" scales size with frequency ]]] ]] .column.bg-main3[.content.vtop.center[ .pad1[.font2[ 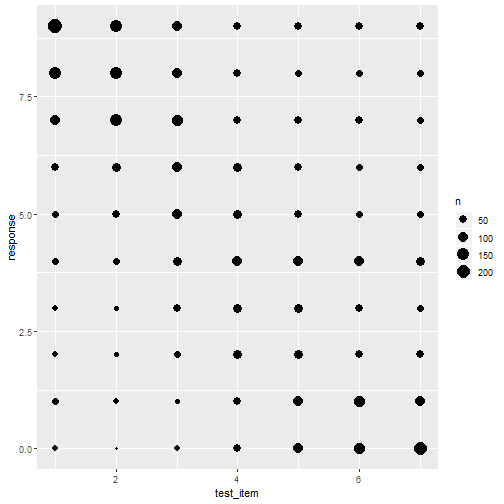<!-- --> ]] ]] <!-- *********** NEW SLIDE ************** --> --- class: split-40 bg-main1 .column.bg-main1[.content.vtop.center[ .pull.left[.pad1[.font2[ ```r frames %>% ggplot(mapping = aes( x = test_item, y = response )) + geom_count() + * facet_grid( * condition ~ sample_size) + * theme_bw() ``` - let's facet in a grid - and switch to a light theme ]]] ]] .column.bg-main3[.content.vtop.center[ .pad1[.font2[ 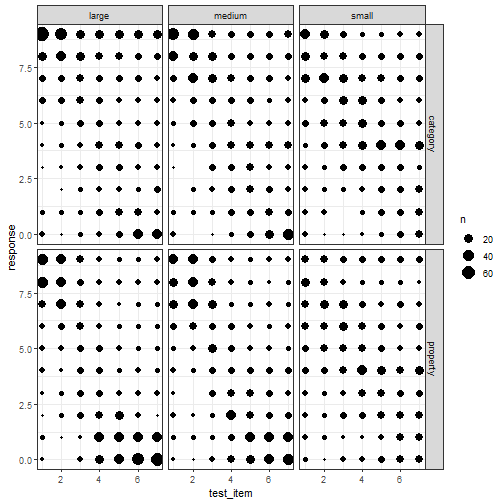<!-- --> ]] ]] <!-- *********** NEW SLIDE ************** --> --- class: split-40 bg-main1 .column.bg-main1[.content.vtop.center[ .pull.left[.pad1[.font2[ ```r frames %>% ggplot(mapping = aes( x = test_item, y = response, * colour = condition )) + geom_count() + facet_grid( condition ~ sample_size) + theme_bw() ``` - play around! - see [the tutorial](https://djnavarro.github.io/chdss2018/visualisation.html) for more ]]] ]] .column.bg-main3[.content.vtop.center[ .pad1[.font2[ 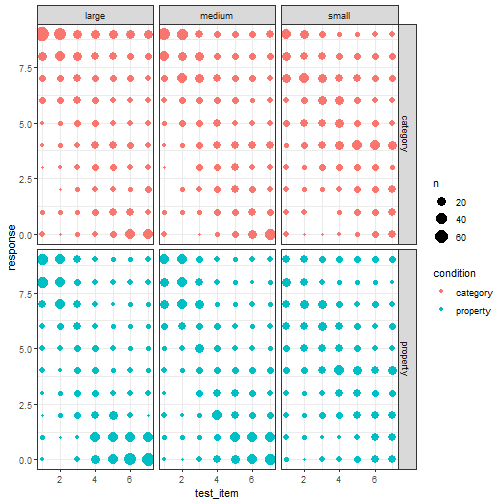<!-- --> ]] ]] <!-- *********** NEW SLIDE ************** --> --- class: bg-main1 center middle hide-slide-number .reveal-text.bg-main2[.pad1[ .font4[Example 7: Error bars. Blegh!] ]] <!-- *********** NEW SLIDE ************** --> --- class: split-40 bg-main1 .column.bg-main1[.content.vtop.center[ .pull.left[.pad1[.font2[ ```r library(lsr) frames_mean <- frames %>% group_by( condition, sample_size, test_item ) %>% summarise( resp = mean(response), * lower = ciMean(response)[1], * upper = ciMean(response)[2] ) frames_mean ``` - use dplyr to add to the data - use lsr::ciMean to get a CI95 - use dplyr to add to the data ]]] ]] -- .column.bg-main3[.content.vtop.center[ .pad1[.font2[ ``` ## # A tibble: 42 x 6 ## # Groups: condition, sample_size [?] ## condition sample_size test_item resp lower upper ## <chr> <chr> <int> <dbl> <dbl> <dbl> ## 1 category large 1 7.60 7.16 8.04 ## 2 category large 2 7.51 7.14 7.88 ## 3 category large 3 6.39 5.95 6.84 ## 4 category large 4 5.39 4.86 5.93 ## 5 category large 5 4.72 4.13 5.30 ## 6 category large 6 4.43 3.79 5.07 ## 7 category large 7 4.18 3.53 4.82 ## 8 category medium 1 7.32 6.85 7.78 ## 9 category medium 2 7.17 6.80 7.54 ## 10 category medium 3 5.98 5.54 6.42 ## # ... with 32 more rows ``` ]] ]] <!-- *********** NEW SLIDE ************** --> --- class: split-50 bg-main1 .column.bg-main1[.content.vtop.center[ .pull.left[.pad1[.font2[ ```r frames_mean %>% ggplot(aes( x = test_item, y = resp, colour = condition)) + geom_point() + geom_line() + * geom_errorbar(aes( * ymin = lower, ymax = upper)) + facet_wrap(~sample_size) ``` - "errorbar" geom draws error bars - just remember to be cautious! - confidence intervals hide *a lot* ]]] ]] -- .column.bg-main3[.content.vtop.center[ .pad1[.font2[ 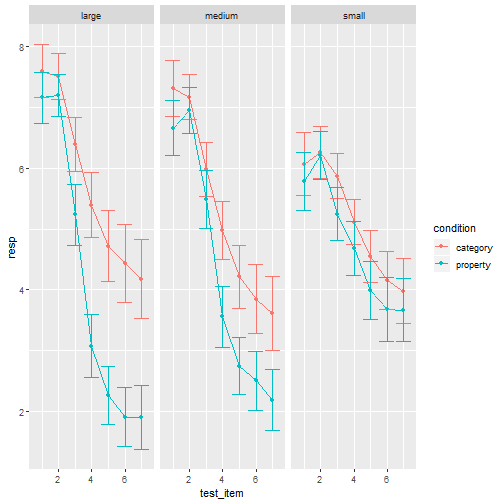<!-- --> ]] ]] <!-- *********** NEW SLIDE ************** --> --- class: bg-main1 center middle hide-slide-number .reveal-text.bg-main2[.pad1[ .font4[Example 8: But wait there's more!] ]] <!-- *********** NEW SLIDE ************** --> --- class: split-40 bg-main1 .column.bg-main1[.content.vtop.center[ .pull.left[.pad1[.font2[ ```r frames_small %>% ggplot(mapping = aes( x = age, y = response, colour = condition)) + geom_point() + theme_bw() + * geom_density_2d() + facet_wrap(~condition) + ylim(0,9) ``` ]]] ]] .column.bg-main3[.content.vtop.center[ .pad1[.font2[ 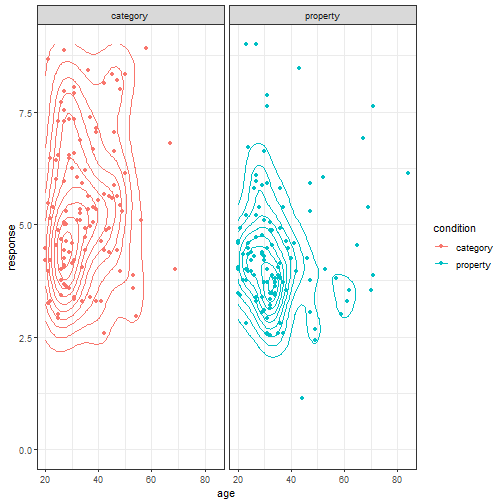<!-- --> ]] ]] <!-- *********** NEW SLIDE ************** --> --- class: center middle hide-slide-number .pad1[ .font4[ Data visualisation exercise: <br> Explore the frames data with ggplot<br> https://djnavarro.github.io/chdss2018/ ]] <!-- DONE --> --- class: bg-main1 middle center ## thank u, next